CASE STUDY
Winning Direct in a Falling Market: The First 90 Days of AI Search
  • SINGAPORE
Winning Direct in a Falling Market: The First 90 Days of AI Search
Branded Hotel Under a Global Flag, Singapore

This version of the case study has been anonymised for wider sharing: the hotel, its brand, its venues, its collaboration partner and its competitive set are deliberately not named, and revenue values are expressed as percentages rather than absolute amounts. All other data, sources and figures are unchanged.

Activation: 1 August 2024, Helium (organic search)
Scope: Organic Search & AI Search: Helium and AI Source Dominance programmes
Transition: Helium suspended 31 March 2026; AI Source Dominance activated 1 April 2026
Measurement Period: 1 April 2026 – 30 June 2026 (3 months)1
Hotel Context

The property is a full-service hotel operating under a global flag, in a central Singapore location. Its most distinctive commercial assets are specific and named (anonymised in this version): several independently positioned food-and-beverage outlets, a signature event venue, and a rooftop leisure facility. The hotel operates its own standalone microsite and worked with another SEO provider before OmniHyper. OmniHyper began working with the property in August 2024, activating Helium (organic search) to build a foundation across organic discovery.

In late 2025 and early 2026 the hotel reached a genuine crossroads. The team could see discovery shifting into AI: the question was no longer only “which page ranks on Google” but “which property does AI recommend when someone asks ChatGPT, Google’s AI Mode, Perplexity or Gemini.” The budget to be a first mover in AI search did not exist alongside the existing programme, so the hotel chose to be dynamic with the budget it had: Helium was suspended and AI Source Dominance was activated on 1 April 2026. This was a reallocation, not an addition. AI Source had to replace the value of traditional search optimisation, not merely supplement it. This case study measures its first three months.

It did so into a falling market. Singapore’s international visitor arrivals declined year on year in both April and May 2026: May arrivals fell 9.7% to 1.24 million (the lowest month of the year), overnight visitors fell 11.8%, and cumulative January–May arrivals were 1.2% below 2025 (June data had not been published at the time of writing).2 Traditional search demand fell harder still. Across an identical set of 1,413 tracked Singapore hotel keywords, Google’s own Keyword Planner records total average monthly search volume down 13.2% year on year for the quarter, with 253 keywords declining against 40 growing; “hotel singapore” itself dropped a full volume tier, from the 50,000 bucket to 5,000.3 Google Trends shows the same pattern, with most top related queries for “hotel singapore” declining, by as much as 30%.4

The search that remained was also resolving differently. Over the measurement period the property’s Google Search Console impressions rose 9.3% (to 533,400) while clicks fell 18% (to 18,226). The hotel was seen more and clicked less, consistent with AI Overviews, AI Mode and other answer surfaces resolving traveller questions before the click.5 This is precisely the environment AI Source exists for: to make the hotel the answer inside AI-generated recommendations, and to convert that visibility into direct demand.

The Challenge

The hotel entered April 2026 with five connected problems:

  • Effectively no AI visibility. No formal AI baseline existed for the hotel before the campaign; the property’s AI brand profile had to be built during the period itself. When brand tracking began, the first measured month (May 2026) recorded just 15 AI mentions across all tracked platforms, with top-3 positions in only 7 non-branded query categories.6
  • An almost entirely branded organic footprint. 28 of the hotel’s top 30 Google Search Console keywords by clicks are branded terms. Outside guests who already know the hotel’s name, the property was essentially not found in organic search, with minimal presence for “business hotel singapore”, “singapore hotel rooftop pool” or the business-travel and events queries the hotel wanted to win.7
  • Third parties owned the AI narrative. Where AI systems did mention the hotel, they drew their story overwhelmingly from third-party sources: the hotel’s own website was cited 18 times against TripAdvisor’s 264, a near 15× gap that left the hotel’s positioning, and every review-site caveat, outside its control.6
  • A shrinking traditional pool. Tracked hotel-keyword search volume down 13.2% year on year, Search Console clicks down 18% even as impressions grew, and city-wide visitor arrivals falling. Demand was contracting exactly where the previous programme was built to compete.2, 3, 5
  • A hard budget constraint. The hotel could not fund traditional SEO and AI search simultaneously. Choosing reallocation meant accepting a known trade-off: suspended traditional optimisation while AI Source scaled.

The objective was clear: make the hotel the answer in AI-assisted discovery, take control of the hotel’s AI narrative through its own content, and convert that visibility into measurable direct demand, in a quarter when the market itself was falling.

Approach

AI Source replaced the suspended Helium programme with a structured answer-engine (AEO/GEO) programme:

  • Named, specific, extractable content. Building the hotel’s story around distinctive named assets (the signature event venue, the independent dining outlets, the central location and the property’s design story), structured with clear answers and FAQs so AI systems can find, understand and cite it. The working pattern: distinctive, named, specific content earns citations; generic hotel copy is invisible.7
  • Named cultural moments. Supporting culturally distinctive, named collaborations, most notably a seasonal food-and-beverage collaboration with a much-loved local heritage brand, that create their own search categories and AI citation classes.6
  • Full-platform AI tracking. Prompt-level monitoring of how the hotel appears across ChatGPT, Google Gemini (including AI Overviews and AI Mode), Perplexity, Claude and Microsoft Copilot: visibility, sentiment, position and citation sources, updated continuously in the OmniHyper dashboard.8
  • Competitive share-of-voice tracking. AI share of voice measured against a named compset of five directly competitive hotels (anonymised here as Competitors A–E), so progress is judged against the hotels the property actually competes with.6
  • Monthly reporting by Mae, OmniHyper’s AI digital marketing agent, to hotel and brand stakeholders, drawn from Google Analytics 4, Google Search Console, the hotel’s commercial workbook and AI Source brand-performance data, including direct written responses to stakeholder questions on methodology and attribution.9
Observable Changes

1 April 2026 to 30 June 2026, vs 1 April 2025 to 30 June 2025 unless labelled otherwise.

Search ranking

  • AI mentions more than tripled in a single month. Across all tracked AI platforms, the hotel’s mentions grew from 15 (May 2026) to 48 (June 2026). The hotel now holds top-3 positions in 15 non-branded AI query categories (queries asked by travellers who have not yet chosen a hotel), including two #1 positions squarely in its commercial strategy: quality 24/7 room service, and modern, creative meeting spaces (the hotel’s event-space positioning, verbatim). Average AI position: 4.73. AI sentiment: 97% favourable.6
  • AI-assisted discovery became a measurable, named channel. ChatGPT delivered 89 tracked sessions in Q2 2026 at a 55.1% engagement rate, well above the 42.3% site-wide average. This is the clearest proof-of-channel the GA4 data provides.10 June alone produced 104 ChatGPT sessions, up 62.5% month on month.9 GA4’s new “AI Assistant” channel, introduced by Google during June 2026, recorded 96 sessions at a 57.3% engagement rate and 119-second average duration in its first weeks.11 Across the quarter, AI-referred users grew 146% year on year, building month by month from 38 users in April to 73 in June.8
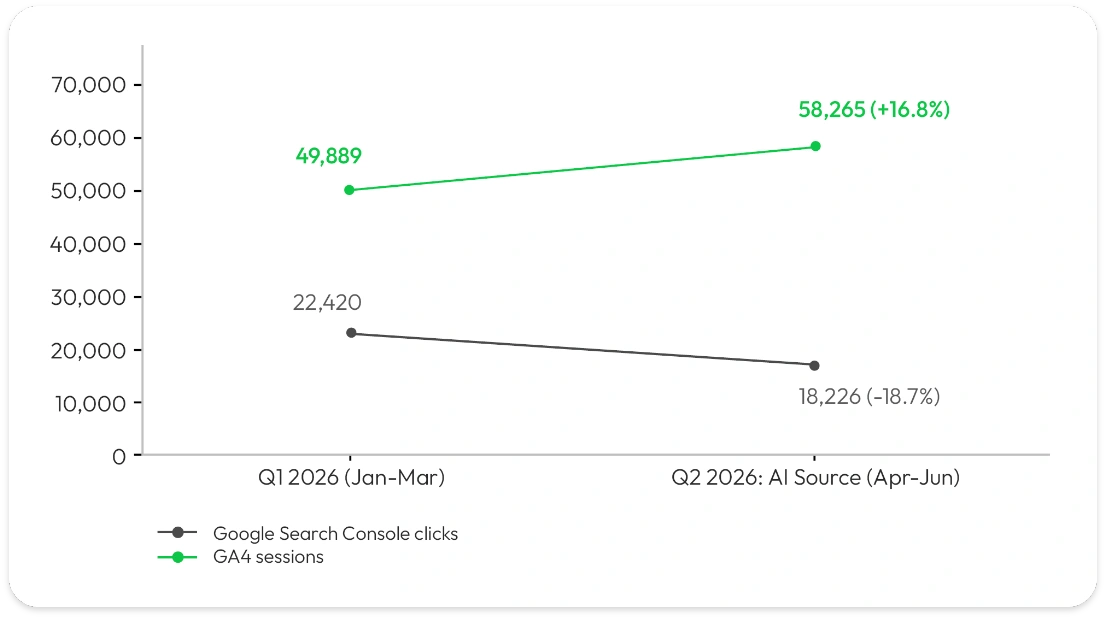
  • Total traffic grew while traditional clicks fell: the signature of a channel shift, not a demand recovery. Sessions rose 18.4% year on year (49,456 → 58,537)11 and 16.8% quarter on quarter, with new users up 31.3% quarter on quarter (86% of all Q2 users were new: net-new discovery, not returning visitors inflating the count). Over the same window, Search Console clicks fell 18% while impressions rose 9.3%.5, 10 The inverse movement of these two metrics is the clearest structural signal in the data: roughly 12,570 sessions arrived beyond what keyword-driven clicks can explain, consistent with discovery migrating to AI referral and other channels Search Console cannot see.10
  • Organic quality improved even as organic volume fell. Average Google position improved from 8.48 to 8.21 quarter on quarter, and Google organic visitors recorded a 64.9% engagement rate in Q2, the highest of any major traffic source, against a 42.3% site-wide average. Fewer clicks, but higher-intent ones, consistent with AI-aligned content attracting better-qualified visitors from traditional search as well.10
  • Named content created its own search categories. The heritage-brand collaboration generated 270 combined clicks in June at click-through rates of 56.9% and 66.3%, among the highest engagement rates ever recorded for the property and the clearest single driver of the June AI-citation surge. The hotel’s named venues pulled independent destination demand: clicks on one venue’s name paired with “singapore” grew 885% year on year.5, 6
  • A competitive AI position now exists where none did. June share of voice reached 0.9% against Competitor A (2.4%), Competitor B (2.2%), Competitor C (1.2%) and Competitor D (0.4%), with Competitor E (69 mentions) the lifestyle benchmark the strategy is built to close on.6 On the dashboard’s monitored 50-prompt set, the hotel is now visible on 75% of prompts at an average position of 1.1, with 21 tracked citations.8
  • Honest watch-items. AI sentiment eased from ~99% to 97%, with AI citing peak-time breakfast crowding and service consistency, mirroring an operational priority already on the hotel’s agenda.6 The own-site citation gap (18 vs TripAdvisor’s 264) remains the core content objective.7 And non-branded Google rankings fell after Helium’s suspension: a net −592 positions across the tracked keyword portfolio, with 21 keywords ranking against 30 a year earlier. This is the accepted, visible cost of reallocating budget from traditional SEO to AI search.12
Figure 1: Google Search Console clicks vs GA4 sessions, Q1 2026 to Q2 2026. Traditional clicks fell while total traffic grew. Sources: Google Search Console; Google Analytics 4 (Mae Rollup, 01 April 2026 – 30 June 2026).
Commercial Indicators

Alongside visibility and engagement, the hotel’s own commercial workbook, populated by the hotel team independently of OmniHyper and of Google Analytics, shows a property that held its ground in a falling market and shifted its mix toward direct:13

  • Occupancy was identical and rate rose in a down market. Average occupancy was exactly flat year on year (80.67% in both periods) while ADR rose 2.1% and total rooms revenue grew 2.0%. This is rate-led growth in a quarter when Singapore’s visitor arrivals were falling year on year.2
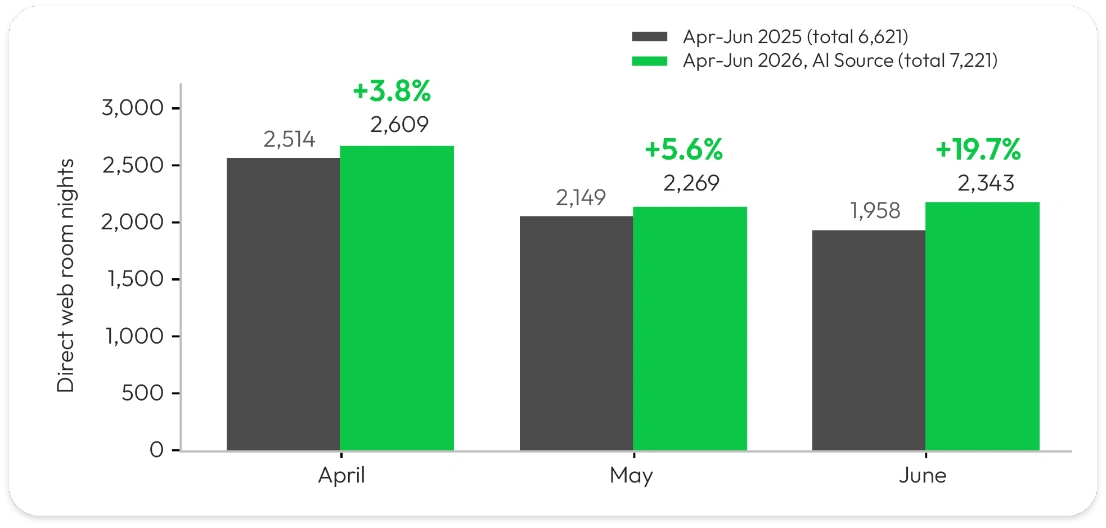
  • The channel mix moved toward direct. Direct web room nights grew by 600 (+9.1%) while indirect (OTA / third-party) room nights grew by just 80 (+1.0%). Direct’s share of the hotel’s room nights rose from 44.6% to 46.5%: the same underlying demand increasingly resolving through the hotel’s own channels.
  • June, the third month of AI Source, is the inflection. Direct web revenue was down 2.6% year on year in April and down 7.9% in May, then up 19.6% in June, on direct room nights up 19.7%, while indirect revenue declined 2.7% and total revenue grew 5.6% at 78% occupancy (+3 points year on year). The commercial turn arrived in the same month AI mentions tripled and the AI Assistant channel went live.9, 13
  • The tracked microsite subset held its base and grew quarter on quarter. GA-tracked microsite revenue rose 13.9% on Q1 2026, on 66 tracked booking transactions, growth recorded in the same period traditional search traffic was declining.10 Year on year it was down 11.8%, but that gap is entirely June 2025’s outlier month: April-plus-May tracked bookings were identical year on year (44 vs 44), while June 2025 recorded 45 bookings against a 2025 monthly average of 27.13
  • A known blind spot: meetings and events revenue is not yet measured. The hotel has not deployed the AI Source MICE Add-On, so meetings and events is not a territory this programme actively targets. Even so, business, meetings and events now lead the AI conversation about the hotel (24.5% of tracked AI queries, including the #1 ranking for modern, creative meeting spaces), visibility earned without a dedicated MICE programme behind it. MICE and C&E revenue, however, is recorded in neither the commercial workbook nor GA4’s booking metrics, so any commercial value arising in this territory is invisible in the figures above. The hotel will include MICE and C&E revenue in the workbook in future so that it can be tracked and measured.6, 13
Figure 2: Direct web room nights by month, April to June, 2026 vs 2025. Up in every month, accelerating to +19.7% in June; +600 room nights (+9.1%) across the quarter, against +80 (+1.0%) for the indirect (OTA) channel. Source: hotel internal channel reporting (commercial workbook, provided by the hotel team).
A Note on Measurement: Why Hotel-Reported Figures Are Used

Read in isolation, Google Analytics on the microsite tells a misleadingly negative story for this property over this period: recorded “book” events down 46.9% and tracked purchases down 25.8% year on year, even as sessions rose 18.4%, and even as the hotel’s own systems recorded 600 additional direct web room nights.11, 13 Three well-understood, documented factors explain the divergence:

  • GA4 is a last-click model watching a subset of the funnel. It tracks only bookings completed on the microsite in the same tracked session: tracked revenue equivalent to roughly 7% of actual direct web revenue in the hotel’s systems. Guests increasingly discover the hotel through AI answers and branded search, then complete on the brand’s central booking site, by phone, or in a later direct session, none of which credit the microsite.11, 13
  • The 2026 traffic mix diluted per-session intent. Paid Social sessions grew 655% (1,135 → 8,573) at an 8.5% engagement rate, with zero tracked purchases and $0 tracked revenue, and Direct sessions grew 88.9% (9,976 → 18,848), the latter inflated by untagged campaign links and a single-day 28 June anomaly that Google’s own anomaly detection flagged: roughly 3,100 direct visits against a forecast of 130.14 With thousands of additional low-intent sessions in the mix, event rates fell mechanically; Organic Search, the highest-intent channel, declined 18.6% in sessions in line with the market-wide click decline. Event-count comparisons against the 2025 baseline therefore overstate any real change in booking behaviour. The hotel’s own workbook, with direct room nights up 9.1%, is the ground truth.11, 13
  • Google changed the channel taxonomy mid-period. GA4’s “AI Assistant” channel began absorbing AI traffic during June 2026. As a result, the legacy chatgpt.com referral line shows −19.4% year on year (62 → 50 sessions) even though total AI-origin traffic grew strongly: AI-referred users +146% year on year, and 104 ChatGPT sessions in June alone. Comparing any single AI line item across the taxonomy change understates AI traffic; the channel must be read in aggregate .8, 9, 11

A mixed-currency tracking issue in January 2026 (resolved in Q2) further limits Q1 revenue comparability.10 There is also a measurement gap in the other direction: meetings and events demand, where the hotel’s AI visibility has grown despite not being actively targeted, is captured by neither GA4 nor the current workbook, so any value arising there goes unrecorded until MICE and C&E revenue is added to the workbook.13 For all of these reasons, this case study follows a simple discipline: commercial outcomes are drawn from the hotel’s own internal reporting, the system of record for what guests actually booked, while Google Analytics and Search Console are used for what they measure reliably: discovery, engagement and intent.

Interpretation

This is a hotel that responded to a structural change in guest discovery by making a deliberate, budget-constrained bet, suspending traditional SEO to fund AI search, in the same quarter its market turned down. Three months in, the evidence runs in one direction. AI mentions tripled to 48, with top-3 positions in 15 non-branded categories and two #1s in the hotel’s target territory. AI-referred users grew 146% year on year and arrived at engagement rates well above site average. Total sessions grew 18.4% while the traditional click pool shrank. And the hotel’s own reporting recorded identical occupancy, a 2.1% ADR gain, 2.0% revenue growth, and a 600-room-night direct gain against a near-flat OTA channel, in a city where visitor arrivals were falling.2

The trajectory matters more than the quarter. April and May were transition months, with direct revenue slightly behind prior year while the programme built its citation base; June, the month AI visibility broke out, delivered direct web revenue up 19.6% year on year while indirect declined. That sequencing, visibility first and bookings following, is exactly the shape an AI-discovery programme should produce, and it is corroborated across independently owned systems. Whatever the programme’s meetings-and-events rankings convert into will be additional to these figures, because MICE revenue is not yet tracked in the hotel’s workbook.

One alternative explanation deserves to be addressed directly, because the hotel invested meaningfully in paid social over the same period: could the direct-channel gains be paid social rather than AI Source? The recorded data says no. Paid Social generated 8,573 sessions in the quarter (up 655% year on year), but those sessions engaged at an 8.5% rate, stayed an average of three seconds, and produced zero tracked purchases and $0 of tracked revenue; recorded booking-intent (“book”) events on the channel actually fell 92% year on year (26 → 2).11 AI-referred visitors show the opposite profile: 55–57% engagement rates and roughly two-minute sessions, with tracked bookings present.9, 10 Timing points the same way. Paid social ran at many times its prior-year level throughout the quarter, yet direct revenue lagged prior year in April and May; the inflection arrived in June, the month AI mentions tripled and the AI Assistant channel went live, when paid social’s own month-on-month growth was at its smallest (+10%).9, 13 Paid social may contribute upper-funnel awareness that the data cannot capture, but on every signal that is measured (engagement, intent events, purchases, revenue and timing), the direct-channel shift tracks AI Source, not paid social.

Attribution deserves honesty. Three months is a short window; absolute AI-referral volumes are still small; the AI Source programme inherited organic foundations built by Helium over twenty months; the hotel and its brand run their own marketing; and non-branded Google rankings declined once traditional optimisation was suspended, a real, visible cost recorded in this document. No single model can isolate one programme’s contribution, and this case study does not claim one. Instead it triangulates five independently owned data sources, none of which rely on OmniHyper to verify:

  • Market demand: Singapore Tourism Board arrivals data, Google Keyword Planner and Google Trends (all public).2, 3, 4
  • Search presence: Google Search Console (Google’s own reporting, brand-accessible).5
  • Website engagement and intent: Google Analytics 4 / Analytics 360 (brand-accessible property).11
  • AI visibility: AI referral traffic in GA4, plus prompt-level AI Source tracking and compset share of voice.6, 8
  • Commercial outcomes: the hotel’s own commercial workbook, populated by the hotel team.13

All five move coherently over the same window, and the improvement concentrates precisely where AI Source was engaged to act: AI citations and referrals, named-asset discovery, and the direct channel. When the market fell, tracked search demand fell, and traditional rankings were deliberately de-funded, and the hotel still held occupancy, raised rate and grew direct share, with the commercial inflection landing in the month AI visibility broke out, the most economical explanation is that AI-assisted discovery is beginning to do the work traditional search used to do. Early days, honestly labelled, but the first ninety days point the right way.

Appendix: Claim-to-Source Map

This case study was intentionally designed to minimise reliance on agency-reported metrics. Wherever possible, outcomes are drawn from systems owned by Google, the hotel’s brand, the hotel itself, or public statistical agencies, allowing every claim to be independently verified.

# Claim Source Window Brand access
1. Market down: Singapore arrivals −9.7% YoY in May 2026
(lowest month of the year); Jan–May −1.2%; tracked
hotel-keyword search volume −13.2% YoY (1,413 keywords);
“hotel singapore” down a full volume tier
STB / SingStat arrivals data; Google Ads Keyword Planner;
Google Trends
Apr–Jun 2026 vs prior Public / reproducible
2. Occupancy identical YoY (80.67%); ADR +2.1%; total rooms
revenue +2.0%
Hotel commercial workbook Apr–Jun 2026 vs prior Hotel / brand internal
3. Direct web room nights +600 (+9.1%) vs indirect +80 (+1.0%);
direct share of room nights 44.6% → 46.5%
Hotel commercial workbook Apr–Jun 2026 vs prior Hotel / brand internal
4. June inflection: direct web revenue +19.6% YoY, direct room
nights +19.7%, indirect revenue −2.7%, total revenue +5.6%,
occupancy 78% (+3pts)
Hotel commercial workbook; Mae June 2026 report June 2026 vs June 2025 Hotel / brand internal
5. AI mentions 15 → 48 in one month; top-3 in 15 non-branded
categories (up from 7) incl. two #1s; avg AI position 4.73;
sentiment 97%; SOV 0.9% vs named compset (Competitor A 2.4%,
Competitor B 2.2%, Competitor C 1.2%)
AI Source Brand Performance (Mae), 8 & 15 July 2026 May–June 2026 Reported; reproducible by querying AI platforms
6. ChatGPT 89 sessions in Q2 at 55.1% engagement (site avg
42.3%); June: 104 ChatGPT sessions (+62.5% MoM); GA4 AI
Assistant channel 96 sessions at 57.3% engagement;
AI-referred users +146% YoY (38 Apr → 73 Jun)
Mae Rollup (GA4 source/medium); GA4 channel data;
OmniHyper AI Source dashboard
Apr–Jun 2026 Direct (GA4 property) + dashboard
7. Sessions +18.4% YoY (49,456 → 58,537) and +16.8% QoQ;
new users +31.3% QoQ; 86% of Q2 users new; ~12,570 sessions
beyond what keyword clicks explain
Google Analytics 4; Mae Rollup Apr–Jun 2026 vs prior year & vs Q1 2026 Direct (GA4 property)
8. GSC impressions +9.3% (533.4K) while clicks −18% (18,226);
average position improved 8.48 → 8.21 QoQ; organic
engagement rate 64.9% (highest of any major source)
Google Search Console; Mae Rollup (GA4 source/medium) Apr–Jun 2026 vs prior periods Direct (Google property)
9. Heritage-brand tea collaboration: 270 combined June clicks
at 56.9–66.3% CTR; venue-name clicks +885% YoY
Google Search Console June 2026 / period Direct (Google property)
10. Last-click paradox: GA4 book events −46.9%, purchases −25.8%
YoY while hotel recorded +600 direct room nights; Apr–May
tracked bookings identical YoY (44 vs 44); gap entirely June
2025 outlier (45 bookings vs monthly avg 27); microsite
revenue −11.8% YoY but +13.9% QoQ; 28 June direct-traffic
anomaly flagged by Google
Google Analytics 4; hotel commercial workbook;
GA4 anomaly insight
Apr–Jun 2026 vs prior Direct (GA4) + Hotel internal
11. Own-site AI citations 18 vs TripAdvisor 264; 28 of top-30
GSC keywords branded; non-branded Google rankings net −592
positions after Helium suspension (21 keywords vs 30)
AI Source Brand Performance; Mae GSC analysis
(15 Jul 2026); Rank Tracker (dashboard)
June 2026 / period Reported + dashboard; GSC direct
12. MICE / C&E blind spot: business, meetings & events
lead the AI conversation (24.5% of tracked queries; #1 for
modern, creative meeting spaces) but MICE revenue is
recorded in neither the workbook nor GA4; revenue to be
added to the workbook in future
AI Source Brand Performance (Mae); hotel commercial workbook June 2026 / forward Reported; Hotel / brand internal
13. Paid Social ruled out as the driver of direct gains: 8,573
sessions (+655% YoY) at 8.5% engagement and 3s average
engagement time, 0 tracked purchases, $0 tracked revenue,
book events 26 → 2 (−92%); AI channels at 55–57% engagement
with bookings present; June inflection coincided with AI
breakout, when paid social MoM growth was smallest (+10%)
Google Analytics 4 (channel report); Mae June 2026 report;
Mae Rollup
Apr–Jun 2026 vs prior Direct (GA4 property)