CASE STUDY
Driving local demand.
  • SINGAPORE
Driving local demand.
A Destination Restaurant at an Internationally Branded Five-Star Hotel, Singapore

Activation: 01 May 2025
Scope: Local Search & Direct Demand Growth (Zone programme)
Measurement Period: 1 May 2025 to 30 June 2026

Measurement note: Zone commenced on 1 May 2025 alongside the launch of the venue’s new microsite. Several data sources (Google Search Console, GA4 key event tracking, SevenRooms spend capture) were only established shortly before or during the programme and have no complete pre-programme history. Wherever a source cannot support a clean like-for-like comparison, figures are presented as programme-period totals rather than growth claims, and every comparative claim is drawn from windows in which the source was fully operational on both sides of the comparison.

Hotel Context

The client is a five-star hotel operating under the flag of a major international hotel group, operating in a competitive city-centre market in Singapore. The hotel runs a large portfolio of restaurants and bars, and management wanted to increase both external guest capture and in-house guest capture across that portfolio, beginning with a single pilot venue.

That venue was a destination restaurant within the hotel, serving a high-volume mix of à la carte dining, set lunches, afternoon dining and special occasion dining.

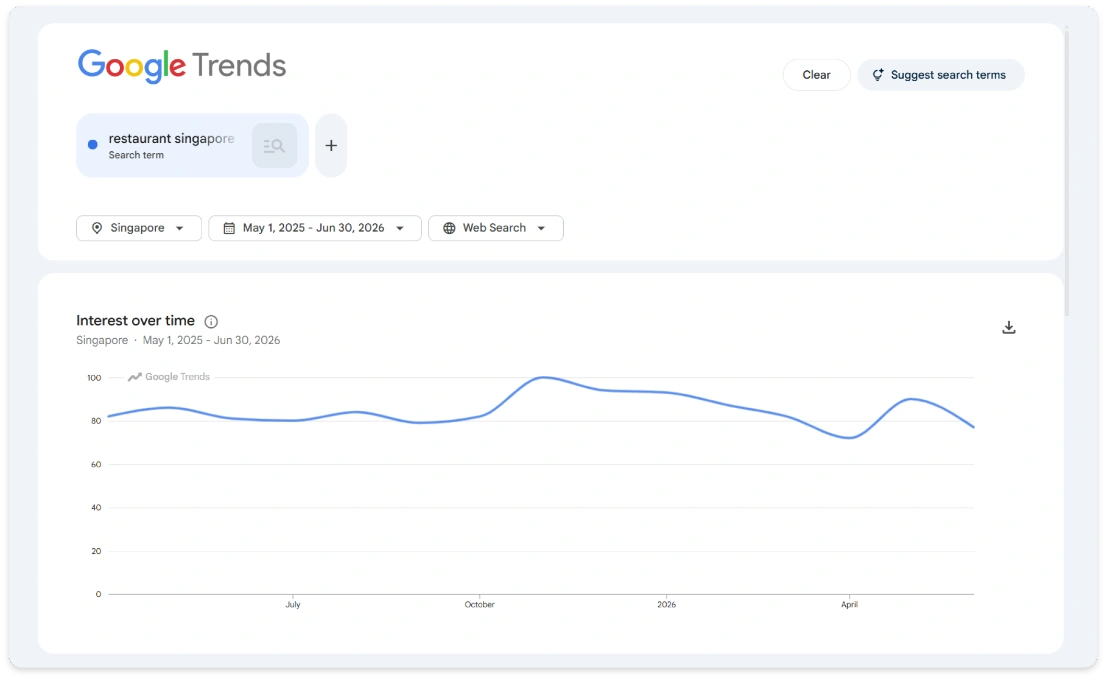
As supporting context, Google Trends indexed search interest for “restaurant singapore” remained broadly stable across the measurement period (86 in May 2025, 77 in June 2026, with a seasonal peak of 100 in November 2025).¹ Google Trends is an indexed measure of interest rather than a volume measure, so it is presented as context only; it does, however, show no clear evidence of a materially rising market behind the results described in this case study.

Before the engagement, OmniHyper’s September 2024 analysis, presented to the hotel’s marketing and commercial leadership, estimated approximately 550,000 relevant local searches per year and modelled venue visibility at around 3% of that demand, with a website conversion rate of approximately 0.25%. The same analysis identified inconsistent name, address and phone data across channels, an undefined secondary Google Business Profile category, and an average review rating of 4.1.2 On a conservative scenario, it projected that Zone could deliver an additional $232,031 in revenue per annum.

The Challenge

The venue faced three core challenges:

  • Weak local mobile discovery: the venue was difficult to find for people searching locally on their phones, particularly across non-brand, high-intent searches.
  • Limited external guest capture beyond guests already staying in, or visiting, the hotel.
  • A website built on Wix, a closed content management system that constrained technical optimisation, performance and structured data.

The objective was clear: be found in local search, and convert that discovery into online bookings, phone reservations and walk-ins.

Approach

The first task was replacing the Wix website with a new mobile-first, open-source microsite on the venue’s own dedicated domain, giving the venue a fast, fully controllable digital foundation. Zone was then deployed from 1 May 2025.

This included:

  • Keyword research and intent tracking across brand, non-brand and near-me local searches.
  • On-page optimisation and structured data across the new microsite.
  • Off-page optimisation, links, citations and channel consistency, correcting the name, address and phone inconsistencies identified in the analysis.
  • Google Business Profile optimisation, posting and review management support.
  • Owned landing pages for the hotel’s seasonal campaign activations, so campaign demand was captured on rankable pages the venue controls.

The programme was engineered to drive three conversion paths: online bookings, phone call reservations, and walk-ins.

Observable Changes

1 May 2025 to 30 June 2026

  • 134,195 clicks and 1.85 million impressions from Google Search, at an average click-through rate of 7.2% and average position of 10.4.3 The microsite’s Search Console property was first verified in June 2025, one month into the programme, so these totals cover approximately 13 of the 14 months and understate full-period performance. No pre-programme comparison exists because Search Console was never set up on the previous website. 69% of all clicks came from mobile devices, consistent with mobile-led local search behaviour, which the microsite was built to serve.3
  • Organic search sessions nearly doubled, up 94% (205,238 vs 105,806) versus the same window a year earlier.4 Total website sessions across all channels grew 211% (667,472 vs 214,610). This total includes paid search and social campaigns that ran concurrently, and is presented as context rather than a programme claim.4
  • Average local ranking position improved from 16.5 to 8.3, while the tracked local search footprint expanded 65.9%, from 987 to 1,637 search terms.5 As at 30 June 2026 this included a top-three local pack position for a category-defining non-brand term describing the venue’s dining experience, alongside top-ten local pack positions for further non-brand category and location terms.5
  • 1.01 million Google Business Profile impressions, 20,229 website clicks and 5,922 call clicks directly from the venue’s profile, alongside 804 Google reviews received at an average rating of 4.47, up from 4.1 at the time of the September 2024 analysis.6 Direction requests, a leading indicator of walk-in demand, grew 4.1% year on year (7,718 vs 7,416, January to June windows).6
  • 5,551 website enquiry form submissions and 5,376 website phone call clicks recorded over the programme window.7 On a clean like-for-like basis (January to June 2026 versus January to June 2025), form submissions grew 75.8% (851 vs 484), phone call clicks grew 17.8% (1,551 vs 1,317) and reserve button clicks grew 673% (8,451 vs 1,093).7

Importantly, growth extended beyond brand searches. Brand variants account for approximately 68% of organic clicks, with the remaining 32% spread across thousands of distinct queries, including non-brand category, occasion and location discovery terms, alongside seasonal campaign-related queries.3

Commercial Indicators

Alongside improvements in visibility and engagement, there was a clear and measurable shift in commercial performance within the venue’s own SevenRooms reporting.

SevenRooms spend capture commenced in January 2025. All growth comparisons below therefore use the cleanest available like-for-like basis: 1 January to 30 June 2026 versus 1 January to 30 June 2025, two seasonally aligned six-month periods in which SevenRooms was fully operational. This is a conservative basis, because the 2025 baseline already includes the programme’s first two months.8

  • Revenue up 7.7% year on year (January to June 2026 versus January to June 2025).8
  • Reservations up 10.0% on effectively flat covers (up 0.2%), lifting spend per cover 7.5%.8 The venue did not simply seat more guests; it captured higher-value demand.
  • Google Reserve bookings up 36.8%, with Google Reserve revenue up 48.8%.8 Google Reserve is the booking path most directly connected to visibility in Google Search and Google Maps.
  • Walk-ins up 175.8%, with walk-in revenue up 124.9%.8 This aligns with rising direction requests and is consistent with improved local visibility: guests who discover the venue on Google and simply show up.
  • Bookings attributed to the venue’s own microsite up 237%, with microsite-attributed revenue up 251%.8

Across the full programme window (1 May 2025 to 30 June 2026), the microsite’s “Reserve A Table” pathway became the venue’s single largest booking source, accounting for 20.1% of all recorded spend, ahead of the reservation platform’s own booking widget. This is a period share, not a growth claim, as prior-period spend data is incomplete.8

Delivery also outpaced the original business case. The September 2024 analysis projected an additional $232,031 in revenue per annum as a conservative scenario²; the programme delivered SGD 284,241.86 of year-on-year uplift within a six-month comparative window, roughly double the projected annual pace.8

Interpretation

This case reflects the compounding effect of a strong owned foundation (the microsite) and sustained local search optimisation (Zone) on commercial performance.

Attribution must be handled honestly. Over the measurement period the hotel also ran seasonal food and beverage campaign activations (visible in campaign-related queries and dedicated offer pages), organic social campaigns and Google paid media. These clearly contributed to overall traffic, which is why total session growth of 211% is presented as context only. This case study does not claim that activity.

The organic and local search improvements are evidenced independently of paid activity: Google Search Console reports organic search only, Google Business Profile reports profile engagement only, and local rank tracking measures positions, not media spend. None of these sources contain paid media.

The claims rest instead on the specific areas Zone was engaged to improve, where the growth is concentrated and consistent across three independently owned data sources, each accessible to the hotel:

  • Search performance: Google Search Console and Google Business Profile (Google’s own reporting).
  • Website engagement: Google Analytics 4 (hotel-accessible property).
  • Commercial outcomes: SevenRooms (the venue’s own reservation and revenue reporting).

Organic sessions up 94%, average local position improving from 16.5 to 8.3, direction requests up 4.1%, walk-ins up 175.8%, Google Reserve revenue up 48.8% and microsite-attributed booking revenue up 251%, all over the same windows, form a coherent chain from visibility, to discovery, to action, to revenue.

The hotel’s own activations also performed better because of the foundation this programme built. Campaign landing pages on the microsite ranked for non-brand campaign terms, including the site’s largest non-brand query, meaning demand generated by marketing activity was captured on owned pages rather than on third-party platforms.

Finally, the result matters beyond a single venue. The restaurant was deliberately run as a single-venue pilot, and the model is repeatable across multi-venue hotel portfolios, where each restaurant and bar competes independently for local demand alongside standalone venues that market themselves aggressively.

No single metric can prove attribution in modern search. But when Google’s own search and profile data, the hotel’s analytics platform and the venue’s own revenue reporting all show sustained improvement over the same period, concentrated in the areas this programme was engaged to improve, they form a consistent and independently verifiable body of evidence.

Appendix: Claim-to-Source Map

The methodology used in this case study was intentionally designed to minimise reliance on agency-reported metrics. Wherever possible, outcomes have been drawn from systems owned by the hotel or by Google rather than by OmniHyper, allowing the findings to be independently verified.

# Claim Source Window Brand access
1. Category search interest broadly stable (86 May 2025; 77 Jun
2026; peak 100 Nov 2025)
Google Trends, “restaurant singapore” (SG) Apr 2025 to Jun 2026 Public
2. Baseline: ~3% modelled visibility of ~550,000 estimated local
searches/yr; ~0.25% conversion; 4.1 rating; NAP inconsistencies;
$232,031 pa conservative projection
OmniHyper Analysis & Opportunities September 2024 Provided to hotel
3. 134,195 clicks; 1.85M impressions; 7.2% CTR; position 10.4;
69% mobile; ~68% brand click share
Google Search Console (venue microsite) 1 May 2025 to 30 Jun 2026 (collection from 3 Jun 2025) Direct (Google property)
4. Organic sessions +94% (205,238 vs 105,806); total sessions
+211% (667,472 vs 214,610)
Google Analytics 4 (venue property) 1 May 2025 to 30 Jun 2026 vs year prior Direct (GA4 property)
5. 5,551 form submissions and 5,376 phone call clicks (totals);
forms +75.8%, phone clicks +17.8%, reserve clicks +673%
(H1 vs H1)
GA4 key events Totals: programme window; growth: Jan to Jun 2026 vs 2025 Direct (GA4 property)
6. Average local position 16.5 to 8.3; tracked terms 987 to 1,637;
local pack positions
Zone local rank tracking (via OmniHyper dashboard and Zone report) Jan to Jun 2026 vs 2025; positions as at 30 Jun 2026 Via OmniHyper dashboard
7. 1.01M profile impressions; 20,229 website clicks; 5,922 call
clicks; 804 reviews at 4.47; direction requests +4.1%
Google Business Profile Totals: programme window; direction requests: Jan to Jun 2026
vs 2025
Direct (Google Business Profile)
8. Revenue +77%; reservations +10.0%; spend per cover +7.5%;
Google Reserve +48.8%; walk-ins +175.8%; microsite path +251%;
microsite path 20.1% of programme-window spend
SevenRooms Booked By reports Jan to Jun 2026 vs Jan to Jun 2025; totals 1 May 2025 to
30 Jun 2026
Hotel internal (SevenRooms)