CASE STUDY
Capturing new demand through AI-driven search.
  • MELBOURNE
Capturing new demand through AI-driven search.
Branded City-Centre Hotel | Melbourne, Australia

Activation: 1 March 2025, Helium (organic search)
Scope: Organic Search & AI Search: Helium and AI Source Dominance (with MICE Add-On) programmes
Measurement Period: 1 October 2025 – 31 May 2026 (8 months)1

Hotel Context

The property is an internationally branded hotel in the heart of Melbourne’s CBD. The website has been live since 2019, but for most of that time the property operated it without a dedicated external search or AI-visibility partner.

OmniHyper began working with the hotel in March 2025, activating Helium (organic search) to build a foundation across organic and local discovery. On 1 October 2025, AI Source Dominance with the MICE Add-On was introduced to extend the property’s visibility into AI-driven discovery environments (Google AI Overviews, ChatGPT and other conversational search interfaces), and to capture high-value meetings and events demand. AI Source built on the organic foundation established by Helium, extending visibility into AI-driven discovery rather than replacing traditional search. This case study measures the eight months from AI Source activation: 1 October 2025 to 31 May 2026.

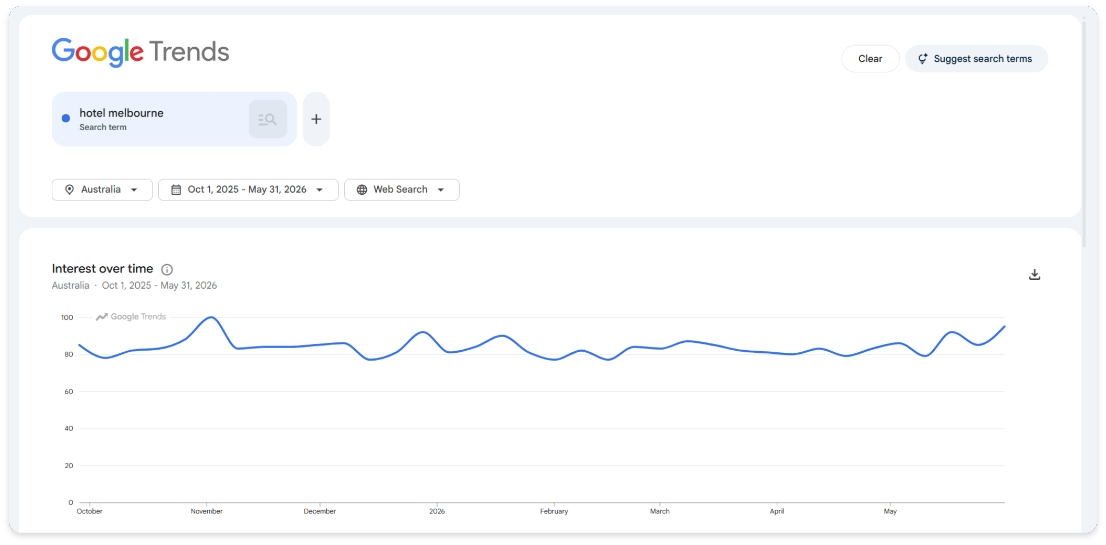
Melbourne’s underlying accommodation demand was stable across the period. Google Trends indexed search interest for “hotel melbourne” (Australia) held broadly between 76 and 100 throughout the measurement window, with no structural decline.2 The hotel’s own occupancy confirms this: average occupancy was essentially flat year on year (77.6% → 77.1%), on a modest ADR uplift of roughly 6%.3 This suggests demand was not the challenge.

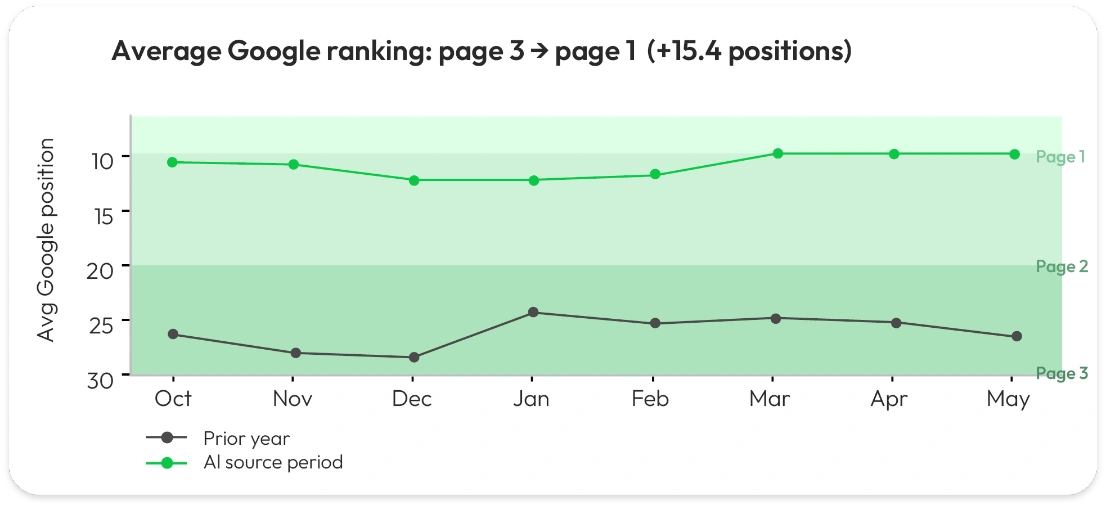
The challenge was where that demand is resolved. Across the measurement period, the hotel’s average Google Search Console position improved dramatically, from 25.9 (page 3) to 10.5 (page 1), yet total search impressions fell 22.8% (1,277,030 → 986,284) and clicks fell 33.7% (14,855 → 9,842) year on year.4 A hotel can rank better than ever and still receive fewer clicks, consistent with the increasing presence of AI-generated answers and other SERP features at the top of the results page, which often answer the traveller’s question before they reach the hotel’s own website. AI Source was deployed to create a parallel pathway: to make the hotel the answer inside the AI-generated answers and search results that now shape how travellers choose a hotel, and to convert that visibility into direct demand.

The Challenge

The hotel faced four connected challenges:

  • The highest-volume generic searches, such as “hotels in melbourne cbd” (60,500 searches a month) and “hotels near me” (550,000), are dominated by OTA’s rather than by individual hotels, and are tracked as some of the hotel’s biggest untapped opportunities.5
  • Search itself is changing: the hotel’s ranking rose to page one, yet its total impressions and clicks fell, a sign that more traveller journeys are being answered on the results page itself rather than on the website.4
  • Competing in one of Australia’s most contested hotel markets, where even the strongest branded searches carry very high volume (18,100 a month for the hotel’s primary branded term).5
  • Effectively no measurable presence in AI-generated answers at the start, in a market where travellers increasingly ask AI assistants for hotel recommendations before they reach a search result or booking site.6

The objective was clear: make the hotel the answer in AI-assisted discovery, strengthen its ownership of branded and related searches, and convert that visibility into measurable direct demand.

Approach

AI Source layered a structured answer-engine programme over the Helium organic foundation, rather than treating AI visibility as a bolt-on:

  • Expanding the website’s content to answer the questions Melbourne travellers actually ask, covering dining (including the hotel’s signature bar and breakfast offer), city-centre attractions, parking, transport and trip planning, so AI systems can find and cite it.
  • Structuring that content so AI and search engines can read it easily, with clear answers, FAQs and consistent hotel information across the site.
  • A dedicated MICE add-on focused on meetings, events and group business, through improved request-for-proposal and group-booking pages.
  • Tracking how the hotel appears across the main AI platforms (ChatGPT, Gemini, Claude, Perplexity and Copilot): how often it is mentioned, how positively, and how it ranks.
  • Monthly reporting by Mae, OmniHyper’s AI digital marketing agent, to hotel and brand stakeholders, drawn directly from Google Analytics 4, Google Search Console and the Rank Tracker.7
Observable Changes

1 October 2025 to 31 May 2026, vs 1 October 2024 to 31 May 2025

  • Search ranking improved to page one, every single month. Average Google position moved from 25.9 (page 3) to 10.5 (page 1), a consistent +15.4-position improvement sustained across all eight months, with the best positions recorded in March (9.58) and May 2026 (9.53).4
  • Website sessions grew 203% year on year (22,146 → 67,126), reaching 69,266 across the full programme period. Growth accelerated from November 2025 onward, with monthly sessions running 171%–360% ahead of prior year and a February 2026 breakthrough month of 10,237 sessions.7, 8
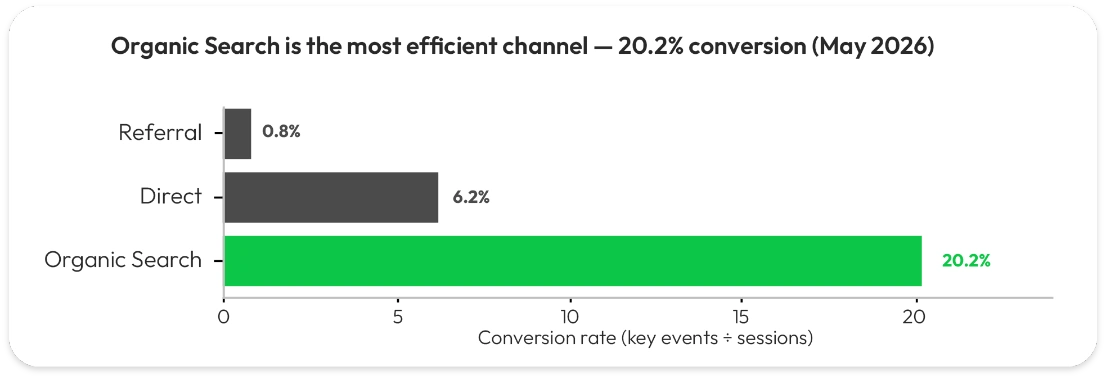
  • Organic Search is the highest-quality channel in the mix. In May 2026 Organic Search converted at 20.2% (293 key events from 1,453 sessions) at a 59.8% engagement rate and 179s average session duration, far ahead of every other channel.8
  • Branded and discretionary search became firmly owned. The property now holds #1 for its three highest-volume location-based hotel searches, #2 for its primary branded term (18,100/mo), with 22 keywords ranking in total and a net +61-position improvement across the tracked portfolio over the period. High-intent branded queries grew strongly in Google Search Console: the primary branded query 585 clicks (+24.3%) and the branded breakfast query 230 (+107.2%).4,5
  • AI-assisted discovery became a measurable channel. ChatGPT referral traffic to the site grew to 168 sessions (+236% YoY), and AI-referred key events stepped up sharply, with chatgpt.com key events up 267% via referral and 1,900% via organic attribution, signalling a discovery pathway that barely existed a year earlier.9
  • AI share of voice surged mid-programme: the “February Breakthrough”. AI Source reporting recorded an 82% rise in the property’s share of voice in a single month (February 2026), the same month the website posted its strongest session growth of the programme (10,237 sessions, +289% YoY). Two independently tracked metrics peaked together, corroborating the AI-visibility gain.7
  • High-intent dining research confirmed the content strategy. The branded breakfast query generated a 32.63% click-through rate in Google Search Console, an exceptional rate for any query. This reflects strong guest research around the property’s dining offer and a direct return on the bar and dining content built under AI Source.4
  • Real-world discovery signals surged on the hotel’s Google Business Profile. Profile impressions reached 357,674 (+52% YoY), with 3,054 phone calls (+48%), 30,563 direction requests (+65%), 5,914 website clicks (+13%) and 912 hotel booking-link interactions, all recorded in Google’s own per-property reporting for the hotel’s own profile.10
  • Meetings & events intent rose in line with the MICE Add-On. Combined request-for-proposal and group-booking page views grew 77% (84 → 149), and recorded key events on the group-bookings proposal pathway rose from 1 to 14 (+1,300%), commercial enquiry value that web-analytics revenue does not capture at all.11
Figure 1: Average Google Search Console position by month; lower is better. Source: Google Search Console.
Figure 2: Conversion rate by acquisition channel, May 2026. Source: Google Analytics 4.

Note on AI visibility. AI-era visibility is evidenced here through the systems available in the client’s own environment: AI referral traffic captured natively in Google Analytics 4, the AI Source share-of-voice tracking reported monthly, and branded search behaviour in Google Search Console. Granular AI mention, sentiment and per-platform ranking exports were tracked in-programme but are not reproduced individually in this document.

Commercial Indicators

Alongside visibility and engagement, the hotel’s own internal channel reporting, populated by the hotel’s revenue team independently of OmniHyper and of Google Analytics, shows a clear commercial shift toward direct business:

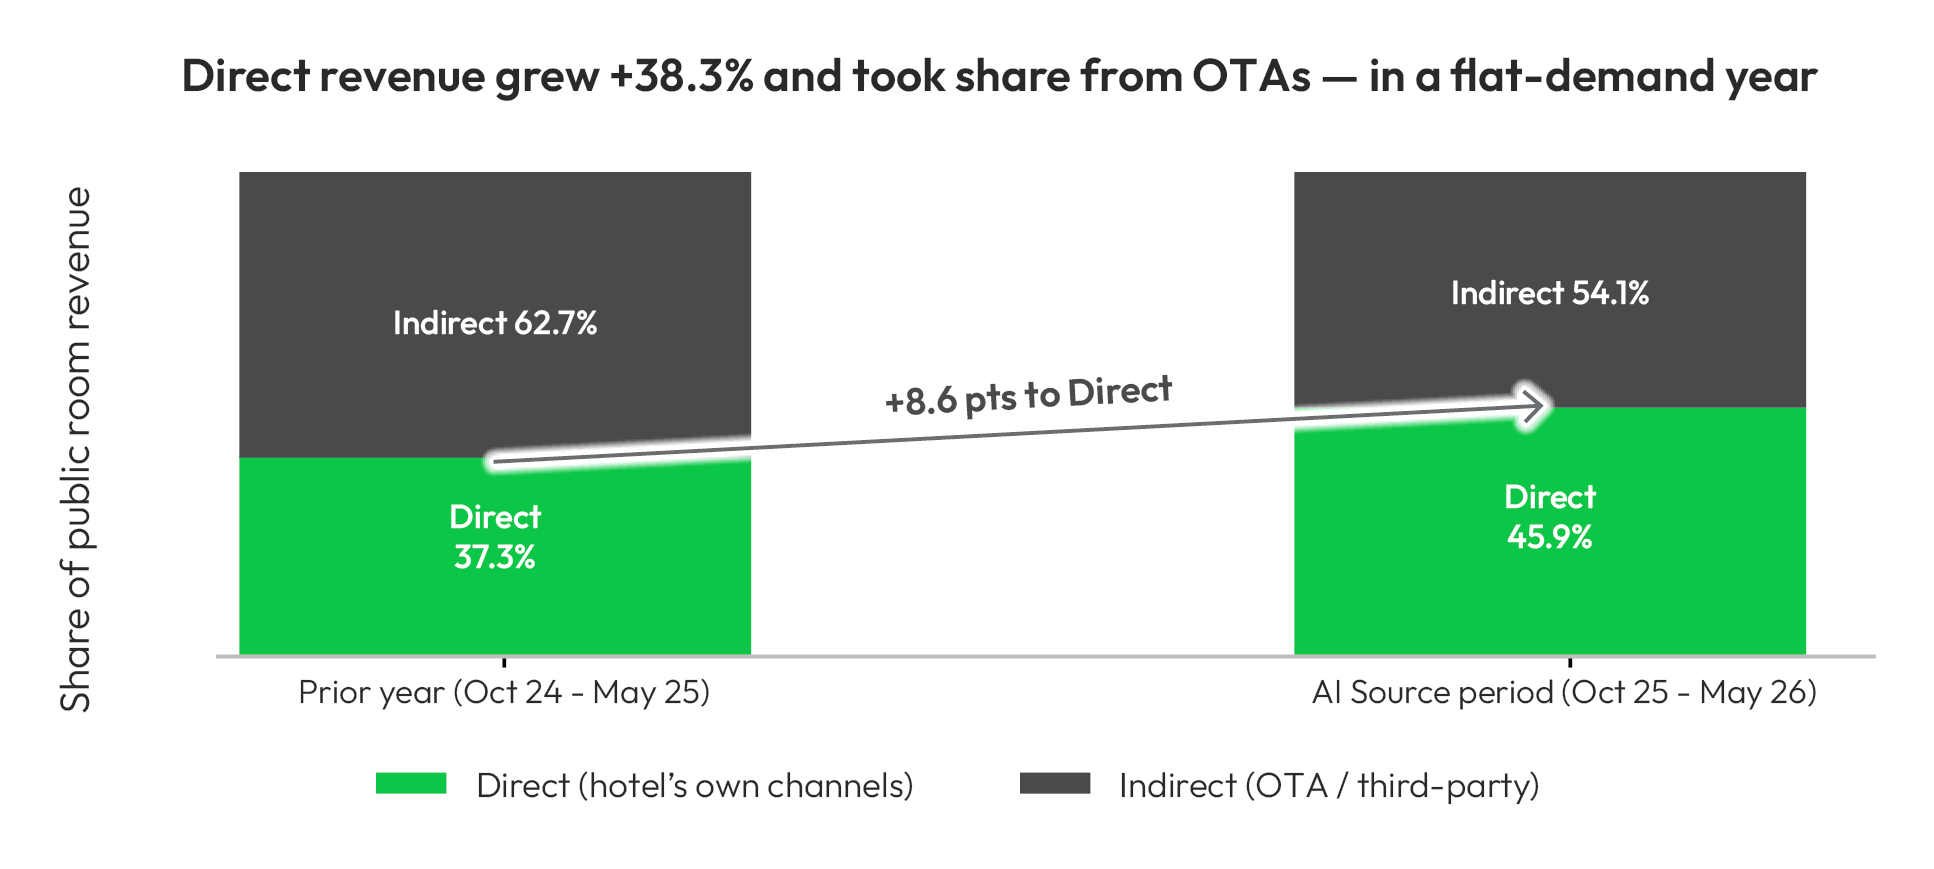
  • Direct revenue grew 38.3% year on year, on direct room nights up 20.2%. This is the hotel’s Public Direct Revenue, drawn directly from its internal systems.3
  • Direct won share from the OTA channel. Direct’s share of the hotel’s public room revenue rose from 37.3% to 45.9%, an 8.6-point shift, as indirect (OTA / third-party) revenue fell 3.0% and total rooms revenue grew only 4.6%. In a year of essentially flat occupancy (≈77%) and a ~6% ADR uplift, direct revenue grew more than six times faster than total revenue, meaning the same underlying demand increasingly resolved through the hotel’s own channels rather than the OTAs.3
  • Meetings, events and group enquiries add commercial value beyond web analytics. The MICE Add-On drove a 77% increase in RFP and group-booking page engagement and a step-change in recorded proposal requests, pipeline value that never appears in a web-analytics revenue figure.11


Figure 3: Direct vs indirect share of public room revenue, prior year vs AI Source period. Source: hotel internal channel reporting.
A Note on Measurement: Why Hotel-Reported Figures Are Used

Two of the systems most often used to “prove” direct performance tell a misleadingly negative story for this property, for well-understood structural reasons.

Google Analytics on the microsite is a last-click model: it credits only conversions completed in the same tracked session. Over this period that last-click view shows recorded key events down 22.1% (4,451 → 3,469)8, even as, on the very same property, sessions rose 203%, branded search grew, AI referrals emerged and the hotel’s own systems recorded direct revenue up 38.3%.

The brand’s regional web-reporting tool, through which website and Google Maps revenue has traditionally been tracked, show the same paradox, recording website revenue down 51.1% and Google Maps revenue down 41.9% over the period.12 The brand itself has acknowledged that these reports have become unreliable, and they are increasingly compressing against the hotel’s actual booking record.

That divergence is not noise; it is the attribution problem this case study is designed to address. Guests increasingly discover the hotel through AI answers, branded search and the microsite, then complete their booking on the brand’s central booking site, by phone, or in a later direct session, none of which credit the microsite under a last-click model. This is precisely why the commercial outcomes above are drawn from the hotel’s own internal reporting, the system of record for what guests actually booked, with Google Analytics used for what it measures reliably: discovery, engagement and intent.3, 8

Interpretation

This is a hotel that responded to a structural change in guest discovery ahead of its competitive set. Over eight months, its search ranking moved from page three to page one on every measured month, its website sessions tripled, AI-assisted referrals emerged as a native channel, and, most importantly, its own finance team recorded direct revenue up 38.3% and an 8.6-point swing in channel share toward direct, in a year when total demand barely moved.

Attribution across channels is inherently complex in a multi-touch, increasingly AI-mediated search environment. The measurement period also includes the ongoing Helium organic programme (active since March 2025) and marketing undertaken by the hotel and its brand; the prior-year baseline, by contrast, ran largely without an external search partner. No single model can isolate one programme’s contribution, and this case study does not claim to. Instead it triangulates five independently owned data sources, each accessible to the brand and the hotel without any reliance on OmniHyper:

  • Search presence: Google Search Console (Google’s own reporting).
  • Local and map discovery: Google Business Profile, per-property export for the hotel (Google’s own reporting).
  • Website engagement and intent: Google Analytics 4 (brand-accessible property).
  • AI visibility: AI referral traffic in GA4 and AI Source share-of-voice tracking, corroborated by branded search behaviour.
  • Commercial outcomes: the hotel’s own internal channel reporting, populated by the hotel’s revenue team.

All five move in the same direction over the same window, and the growth concentrates strongly in the areas where AI Source was engaged to act: brand-related and content discovery, AI citations and referrals, branded-search ownership, and direct channels. The last-click paradox strengthens rather than weakens this case. If microsite last-click analytics or the brand’s web-revenue reports were the only lens, this would look like a flat or declining year. Sessions up 203%, ranking up to page one, ChatGPT referrals up 236%, and direct revenue up 38.3% in the hotel’s own systems say otherwise.

No single metric can prove attribution in modern search. But when Google’s search data, Google’s business-profile data, the hotel’s analytics property and the hotel’s own commercial reporting all show sustained improvement over the same eight months, concentrated in the areas AI Source was engaged to improve, they form a coherent body of evidence substantially stronger than any individual attribution model.


Appendix: Claim-to-Source Map

This case study was intentionally designed to minimise reliance on agency-reported metrics. Wherever possible, outcomes are drawn from systems owned by Google, the brand or the hotel itself, allowing every claim to be independently verified.

#ClaimSourceWindowBrand Access
1.Demand stable: "hotel melbourne" search interest held ≈76–100; occupancy essentially flat (77.6% → 77.1%)Google Trends; hotel internal reportingOct 2025 – May 2026Public; Hotel/brand
2.Ranking improved from page 3 to page 1 (avg position 25.9 → 10.5, +15.4) every month; impressions −22.8% and clicks −33.7% YoYGoogle Search ConsoleGoogle Search ConsoleDirect (Google property)
3.Sessions +203% (22,146 → 67,126); programme total 69,266 (+222.8%); Feb 2026 peak 10,237Google Analytics 4Oct 2025 – May 2026 vs priorDirect (GA4 property)
4.Organic Search best-quality channel: 20.2% conversion (293/1,453), 59.8% engagement, May 2026Google Analytics 4May 2026Direct (GA4 property)
5.#1 on top location-based hotel terms; #2 primary branded term (18,100); 22 keywords ranking, net +61; branded query clicks +24–107%Rank Tracker / SEMrush; Google Search ConsoleAs at May 2026Via dashboard; reproducible + Google property
6.ChatGPT referrals 168 sessions (+236%); AI-referred key events +267% / +1,900%Google Analytics 4 (source/medium)Oct 2025 – May 2026 vs priorDirect (GA4 property)
7.Hotel GBP impressions 357,674 (+52%); calls 3,054 (+48%); directions 30,563 (+65%); website clicks 5,914 (+13%)Google Business Profile (hotel profile)Oct 2025 – May 2026 vs priorDirect (Google property)
8.MICE: RFP + group-booking page views +77% (84 → 149); group-booking proposal key events 1 → 14 (+1,300%)Google Analytics 4 (Pages & screens)Oct 2025 – May 2026 vs priorDirect (GA4 property)
9.Direct revenue +38.3%; direct room nights +20.2%; direct share of public revenue 37.3% → 45.9%; indirect −3.0%; total +4.6%Hotel internal channel reportingOct 2025 – May 2026 vs priorHotel / brand internal
10.Last-click / brand-report paradox: GA4 key events −22.1%; brand web-report revenue −51.1%, Maps −41.9%Google Analytics 4; brand web-reporting toolOct 2025 – May 2026 vs priorDirect (GA4) + brand reporting
11.AI share of voice +82% in February 2026, peaking with the 10,237-session month; "breakfast" query CTR 32.63%AI Source Google Data Report (Mae); Google Search ConsoleFeb 2026 / periodReported; GSC direct