CASE STUDY
Driving direct demand.
  • PERTH
Driving direct demand.
A Globally Branded Hotel, Perth CBD

Activation: 01 August 2023
Scope: Organic Search & Direct Demand Growth (Helium programme)
Measurement Period: 1 August 2023 – 31 January 2026

Measurement note: The reporting window is deliberately capped at 31 January 2026, prior to the commencement of a separate programme (AI Source) shortly thereafter. All results in this case study therefore reflect the Helium programme in isolation. The Helium programme continued beyond this date.

Hotel Context

The subject hotel is a centrally located property in the Perth CBD, operating under a global hotel flag in a competitive urban market. At the time of engagement, the hotel had recently launched a new website and had minimal organic search visibility, with non-brand discovery effectively starting from zero.

Australia’s accommodation market remained resilient throughout the programme period, with national accommodation occupancy averaging 72.9% in 2025, up 1.9 percentage points year on year, and growth in international visitation in 2025 particularly strong in Western Australia.¹ Demand was not the challenge.

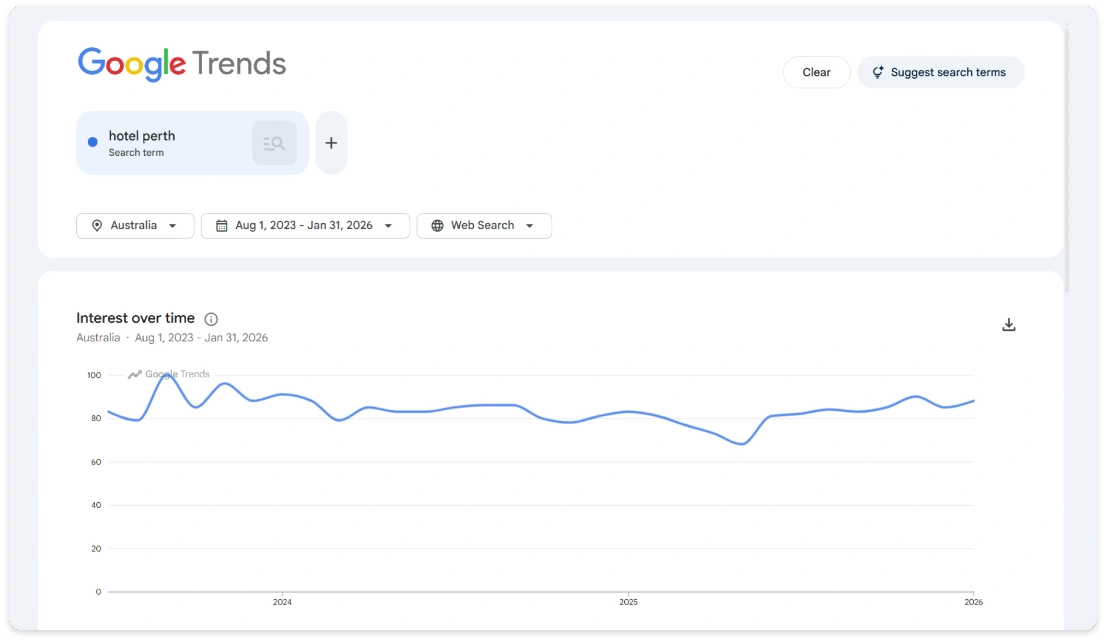
The challenge was digital. The way travellers research and book accommodation changed fundamentally over the programme period. Third-party estimated search volumes for core Perth accommodation terms, including “hotel perth” (22,200 estimated monthly searches, down 63% year on year) and “hotels perth cbd” (18,100 estimated monthly searches, down 76% year on year), declined by between 63% and 76% by March 2026.² Over the same period, Google Trends indexed search interest for “Hotel Perth” remained comparatively stable.³

Read together, these two independent signals point to a structural shift rather than a fall in travel intent: travellers are still searching, but a growing share of those journeys are being resolved without a click, answered by AI assistants and AI-generated search results before users ever reach a hotel website. Clickstream-based volume estimates, which reflect click activity, have collapsed; query interest has not.

The practical consequence for hotels is the same either way: the traditional keyword-driven pathway to direct bookings became materially less productive, increasing reliance on OTA channels and placing pressure on direct booking performance.

The Challenge

The hotel faced three core challenges:

  • No meaningful organic visibility following a new website launch.
  • Heavy reliance on OTA channels for bookings.
  • Limited exposure to discretionary demand beyond branded search.

The objective was clear: grow direct demand and reduce dependence on third-party channels over time.

Approach

Rather than focusing on a single channel, the approach centred on improving overall discoverability and demand generation across search.

This included:

  • Strengthening organic search visibility across high-intent and discovery-based queries.
  • Aligning content and on-site experience with key guest personas.
  • Building authority and relevance through ongoing optimisation.
  • Working closely with the hotel team to refine positioning and messaging.

This created a consistent and scalable foundation for long-term direct demand growth.

Observable Changes

1 August 2023 to 31 January 2026

  • A cumulative gain of 1,148 ranking positions across a tracked portfolio of 66 high-intent keywords, with 64 ranking as at 31 January 2026. This includes position-one results for street-level non-brand location terms (specific terms withheld to preserve anonymity), and top-five positions for “conference venues perth” and “family accommodation perth”.4
  • 1.94M+ search impressions and 47,900+ organic clicks, at an average click-through rate of 2.47%.5
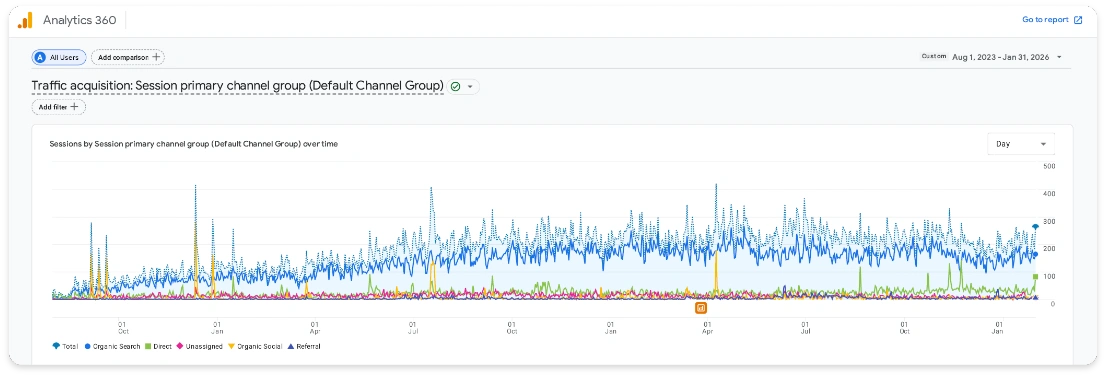
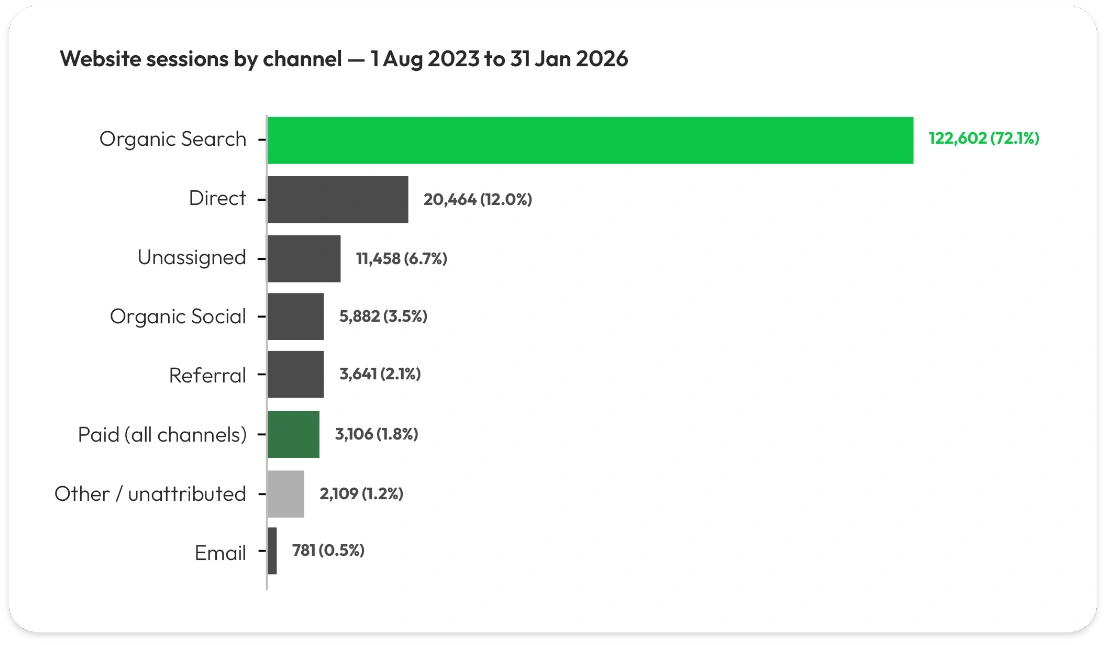
  • 170,000+ website sessions, with organic search contributing 122,602 sessions (72% of all traffic).6
  • Direct booking channels (Hotel Website and Google Maps) grew in both full calendar years of the programme, with
    combined revenue up 61.9% in 2024 and a further 25.5% in 2025.7

Importantly, this growth extended beyond brand terms. The five largest queries (all brand variants) account for approximately 28% of total organic clicks, with the remainder spread across more than 8,000 distinct queries, including non-brand discovery terms such as “spa perth”, “conference venues perth” and location-based accommodation searches.5

Website sessions by default channel group. “Paid (all channels)” combines Paid Social, Paid Search, Paid Other and Cross-network; “Other / unattributed” is the residual between channel-level rows and the period total of 170,043. Source: Google Analytics 4.6
Commercial Indicators

Alongside improvements in visibility and engagement, there was a clear and measurable shift in commercial performance across the hotel’s own internal reporting:

  • Direct revenue over the measurement period was split approximately 54% Hotel Website and 46% Google Maps (1 Aug 2023 to 31 Jan 2026). 8
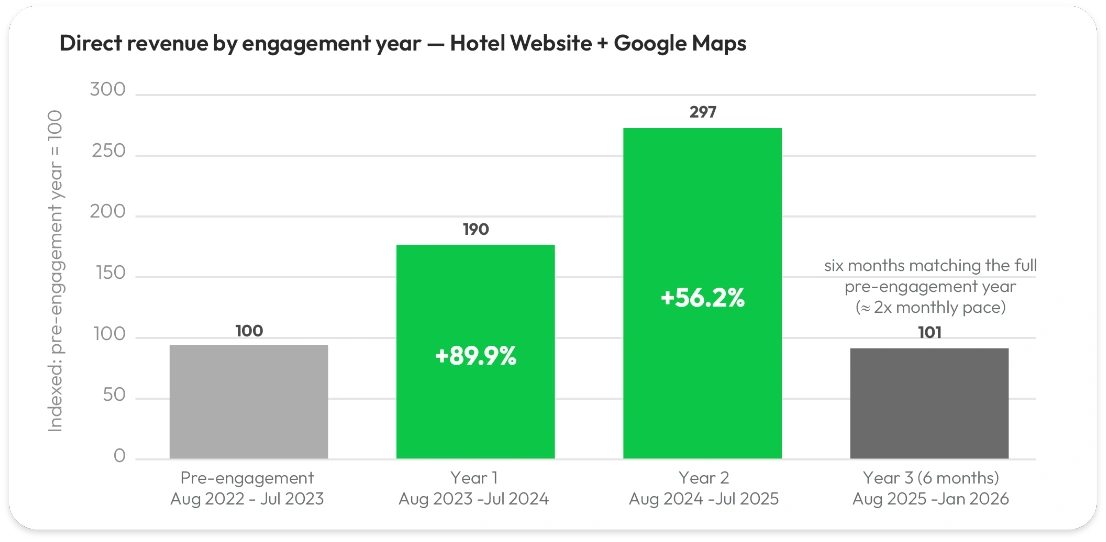
  • 89.9% growth in the first 12 months of engagement (Aug 2023 to Jul 2024) compared to the prior 12-month period (Aug 2022 to Jul 2023), measured on the hotel’s own reported direct revenue.8
  • 83.6% growth in direct bookings and 88.1% growth in room nights in the first 12 months of engagement versus the prior 12-month period.8
  • Direct bookings and room nights grew in every engagement year across the full measurement period.8

Growth compounded rather than plateaued: combined direct revenue grew a further 25.5% in calendar 2025 versus 2024 (bookings up 11.9%, room nights up 12.9%), against a market backdrop of sharply declining traditional search activity.8

Direct revenue by 12-month engagement year (Hotel Website + Google Maps), indexed to the pre-engagement year (Aug 2022 – Jul 2023) = 100. Year 3 covers the six months to 31 Jan 2026. Source: Internal brand channel reports.8

22,650 form submissions generated via the website over the period, including MICE, conference and group booking enquiry forms.9  These enquiries sit outside room-revenue attribution but represent significant additional commercial value, particularly in the group and events segment.

As a result, total commercial impact extends beyond what is visible through last-click room revenue metrics alone.8

Interpretation

This case reflects the compounding impact of improved discoverability on commercial performance.

Starting from minimal organic visibility on a newly launched website, the hotel achieved sustained growth across search visibility, engagement and direct demand, ultimately translating into measurable increases in revenue, bookings and room nights within the brand’s own channel reporting.

Importantly, this growth occurred against a deteriorating backdrop for traditional search. While clickstream-based estimates of keyword volumes fell sharply, the hotel grew direct performance in both full calendar years of the programme by capturing demand across a broader range of discovery pathways: non-brand, long-tail and high-intent queries alongside brand search and Google Maps.

Attribution across channels remains inherently complex in a multi-touch, increasingly fragmented search environment. This case study does not rely on a single attribution model. Instead, it triangulates three independently owned data sources, each accessible to the hotel brand:

  • Search performance: Google Search Console (Google’s own reporting).
  • Website engagement: Google Analytics 4 (brand-accessible property).
  • Commercial outcomes: The brand’s own internal channel reporting.

The consistency of uplift across all three sources, over the same window, indicates a clear relationship between improved discoverability and direct performance. This does not exclude the contribution of other marketing activity undertaken by the hotel or its brand. Rather, the pattern of growth, concentrated in organic search (72% of all traffic), non-brand rankings and direct booking channels, aligns directly with the specific areas the programme was engaged to improve.

Beyond room revenue, improved visibility also generated a substantial volume of website enquiries, including MICE, conference and group booking forms, which sit outside standard room-revenue attribution but carry significant commercial value across both transient and group segments.

No single metric can prove attribution in modern search. But when Google’s own search data, the hotel’s analytics platform and the brand’s own commercial reporting all show sustained improvement over the same period, concentrated in the areas this programme was engaged to improve, they form a coherent body of evidence that is substantially stronger than any individual attribution model.

Appendix: Claim-to-Source Map

The methodology used in this case study was intentionally designed to minimise reliance on agency-reported metrics. Wherever possible, commercial outcomes have been drawn from systems owned by the hotel brand or Google rather than OmniHyper, allowing the findings to be independently verified.

# Claim Source Window Brand access
1. National occupancy 72.9% (2025), +1.9ppt; WA international
visitation growth particularly strong
Tourism Research Australia, Australia’s visitor economy in
2025 – Annual benchmark report, pp. 24, 38, 42 [CoStar data]
CY2025 Public
2. Estimated head-term search volumes down 63% to 76% year on year SEMrush (via OmniHyper Rank Tracker) Mar 2026 vs Mar 2025 Via OmniHyper dashboard; reproducible in any SEMrush account
3. Search interest comparatively stable Google Trends, “Hotel Perth” [AU] Jun 2023 to Mar 2026 Public
4. +1,148 cumulative ranking positions; 64 of 66 keywords ranking;
position-one non-brand results
SEMrush Rank Tracker (via OmniHyper dashboard) 1 Aug 2023 to 31 Jan 2026 Via OmniHyper dashboard
5. 1.94M impressions; 47,930 clicks; 2.47% CTR; ~28% brand click
concentration
Google Search Console 1 Aug 2023 to 31 Jan 2026 Direct [Google property]
6. 170.0K sessions; 122,602 organic [72% share] Google Analytics 4 1 Aug 2023 to 31 Jan 2026 Direct [GA4 property]
7. +89.9% direct revenue first 12 months; +83.6% bookings;
+88.1% room nights; 2025 +25.5%
Internal brand channel reports [Hotel Website + Google Maps] 1 Aug 2023 to 31 Jan 2026 Brand internal
8. 22,650 form submissions GA4 form_submit event 1 Aug 2023 to 31 Jan 2026 Direct [GA4 property]