CASE STUDY
First mover in Perth’s AI search.
  • PERTH
First mover in Perth's AI search.
Investment, discovery and early results
AI Source live 1 April 2026. AI search can take 6 to 9 months to show clearly in commercial results. Commercial figures compare 2026 with 2025 and with 2024, before the 2025 refurbishment..

THE INVESTMENT

6 months

AI Source (Midscale Hotel tier), months 1 to 6 of a 12 month programme. Setup fee waived.

Source: OmniHyper contract, signed 27 February 2026..

WHAT CHANGED IN DISCOVERY

#1 for 8 guest questions

First answer, with 100% favourable sentiment, in July and August, five of them won since April.

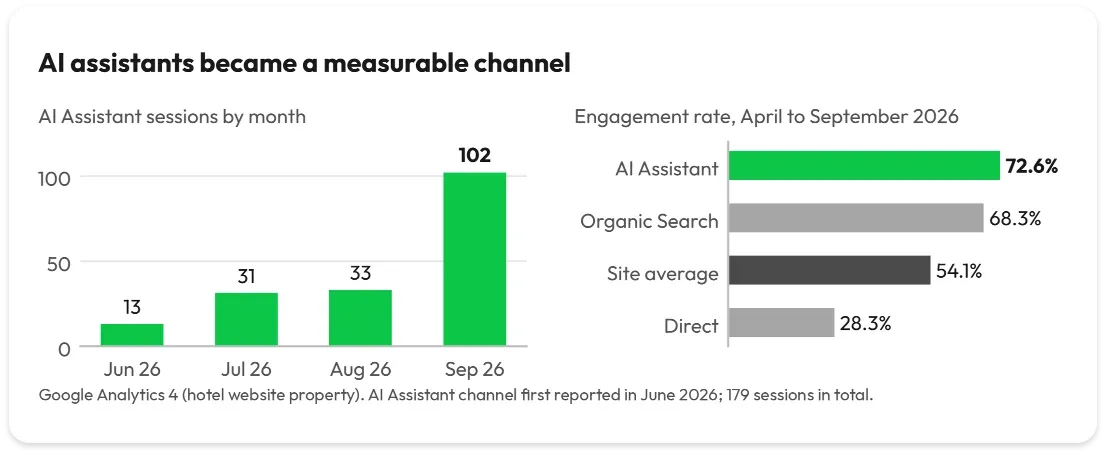
From the lap pool to small meetings without a high minimum spend. Google AI Mode sentiment rose from 77% to 100%. AI assistants sent 179 sessions from June, the most engaged channel on the site at 72.6%.

Source:  AI Source monthly reports (Mae); Google Analytics 4.

EARLY COMMERCIAL INDICATORS

+30.5%

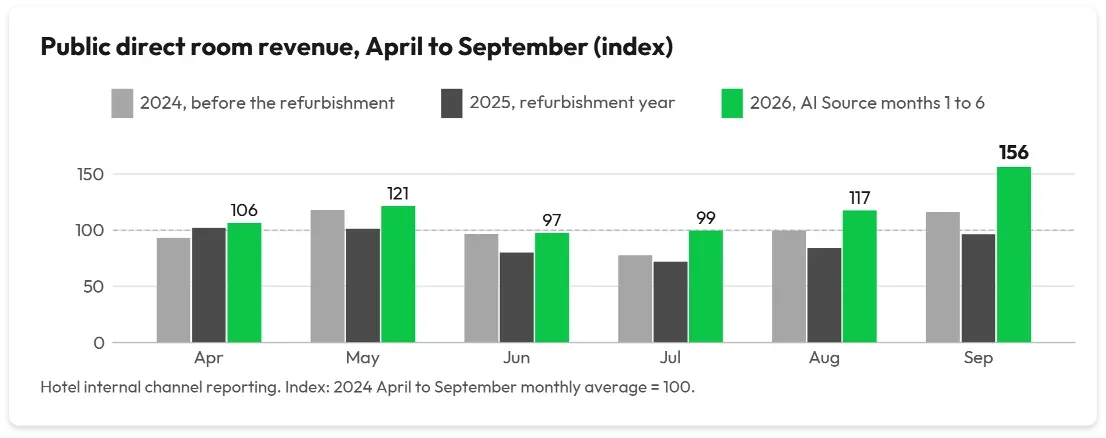
Public direct room revenue, April to September, year on year, and higher than both 2024 and 2025 in every month.

Direct revenue +16.3%

While OTA revenue fell 3.5%, against 2024, the last year before the refurbishment. Direct room nights held as OTA room nights fell 14.0%.

September direct revenue rose 62.6%, at a 62.2% direct share, the highest in 33 months of records. Indirect also rose 32.4% on 2025 as the hotel recovered.Source: The hotel’s own channel reporting (Commercial Reporting workbook).

Please note: these outcomes cannot be attributed solely to AI Source. The refurbishment completed at the end of 2025, revenue management, brand marketing and trading conditions also influenced performance; occupancy was 87.7%, against 62.9% in 2025 and 81.5% in 2024.

Full source : First Mover in Perth’s AI Search. Every claim sourced, with a claim-to-source map. Figures exclude GST.

Perth Hotel Australia

Activation: 1 April 2026, AI Source (Midscale Hotel) on the hotel’s existing website after setup and alignment in March 2026

Scope: AI search optimisation (AEO and GEO) across Google AI Overviews and AI Mode, ChatGPT, Gemini and Perplexity

Measurement Period: 1 April 2026 to 30 September 2026, months 1 to 6 of a 12 month programme1

Hotel Context & Market Changes

The hotel is a branded, full service hotel on the fringe of the Perth CBD, part of an international hotel group, with balcony rooms, a pool, a restaurant and bar, and flexible meeting space suited to small and mid sized events.9 The hotel already had its own website and ran its own marketing activity. Early in 2026 it saw an opportunity in AI search. The hotel signed for AI Source on 27 February 2026, OmniHyper completed the initial optimisation and alignment in March, and AI Source activity began on 1 April 2026.2


Demand for Perth was not the constraint. Google Trends indexed interest for “hotel perth” averaged 96 from April to September 2026, against 83 for the same months of 2025, and “accommodation perth” averaged 87 against 85.3 Horwath HTL, using STR data, records Perth RevPAR up 5.1% for the year to June 2026, describes Perth occupancy as already high, and forecasts hotel supply growth of 1.9% a year to 2030.4 Destination Perth’s visitor data was more mixed, with overnight visitors up year on year in April, May and August and down in June and July.5

The comparison year was not a normal one. The hotel carried out a full rooms refurbishment through most of 2025, affecting both rooms and food and beverage revenue to an extent that is not fully known. Average occupancy from April to September was 62.9% in 2025, against 81.5% in 2024 and 87.7% in 2026.6 Much of the year on year growth in 2026 is therefore recovery from the refurbishment, and this study says so wherever it applies. To show what changed beyond that recovery, 2026 is also compared with April to September 2024, the last full period before the refurbishment.

Against that 2024 baseline, the hotel’s channel position was a familiar one. OTAs supplied 55.0% of public room revenue against 45.0% booked direct, and indirect room nights outnumbered direct by 18.7%.6 The hotel’s name was well known in search: across the full Search Console record, searches for the hotel’s name, including a common misspelling, supplied 28.6% of the website’s clicks.7

The question for the programme was therefore not whether travellers were looking for a Perth hotel. It was whether a hotel that people already knew by name could become the answer when travellers, event planners and AI systems asked about Perth without naming it, and whether that would show in the hotel’s own direct channel.

The Challenge

The property came into the period with a well known name, a refurbished product and four connected problems, all of them about being found, described accurately and credited.


  • Other sources were telling the hotel’s story. In the April baseline the hotel’s own website supplied just 1.9% of AI citations about the property, behind google.com at 15.5%, tripadvisor.com at 8.6%, expedia.com at 2.9% and the websites of two other Perth hotels.9
  • The hotel was an “also consider”. In Google AI Mode it held 3.5% share of voice, against 6.5% to 7.8% for four competing upscale and luxury hotels in Perth. Its average position in AI shortlists was 4.84 and favourable sentiment 77%, behind the market’s perception leaders.9
  • AI answers still described the hotel before its refurbishment. Dated rooms, worn bathrooms and renovation disruption appeared at high frequency in AI summaries of guest feedback, and guests who liked the location cited them as reasons to switch to competitors.9
  • The highest value searches were not being won. AI demand around the property was 80% research led, and meetings, conferences and events was the largest single topic at 23.5% of questions, with business travel a further 18%.9 Yet across the full Search Console record the meetings page averaged position 31.27, with a click through rate of 0.2%.7

There was also a measurement problem underneath the commercial one. Every booking completes on the brand’s booking website, so the website cannot record a reservation or its value: Google Analytics records no revenue, and its key events are booking intent clicks rather than bookings.8 The brand’s own reporting credits the website only when it is the last click before booking.10 The hotel therefore completed its own channel workbook, so that outcomes could be measured in the hotel’s own figures.6

AI search is also a long term channel. The hotel understood from the outset that it typically takes six to nine months to show commercially, and entered the programme as a first mover in the Perth market in the hope of earlier wins.

The objective was therefore to make the hotel the one that AI systems recommend first for the specific questions it genuinely answers best, to replace third party descriptions with the hotel’s own, and to turn that visibility into direct business, measured wherever possible in the hotel’s own figures.

Approach

AI Source was the whole programme. The Midscale Hotel tier extends the core brand, rooms and location work of the entry tier to facilities, dining and broader guest needs.2,11

  • Setup and alignment, March 2026. Answer engine optimisation of the hotel’s website, including semantic analysis, structured data enhancement, content refinement and question and answer optimisation, provided as part of the annual subscription.2
  • Ongoing optimisation, from 1 April. Monthly structured data and semantic refinement, optimisation of content and citations, and AI visibility tracking across Google AI Overviews and AI Mode, ChatGPT, Gemini and Perplexity, reported monthly by Mae, OmniHyper’s AI strategist.2,11
  • Own the specific occasion, not the generic list. The monthly analysis showed where AI systems already trusted the hotel and set the strategy to own those occasions: genuine balconies with guaranteed views, quiet business stays on the fringe of the CBD, small meetings without high minimum spends, intimate weddings, lap swimming in the pool and events at a nearby park, rather than competing for “best hotel in Perth”.9
  • A machine readable hotel. A rendered crawl in August and a full census of 207 URLs in October confirmed Hotel markup on 13 pages, FAQ Page markup on 2,898 words of question and answer content, and Restaurant, EventVenue, HotelRoom and Offer markup on the dining, meetings and room pages. OmniHyper corrected the accommodation page, published under an internal working title with no description; its search clicks more than doubled from August to September.9
  • Measurement built in. Tracking moved from one platform to four in August, each reported separately; an attribution screen was run on June to August; and in September branded searches were tested for any loss of clicks to AI Overviews. None was found: branded click through rate rose from 9.88% to 9.99%.9

What is live and what is pending. Several of the largest recommended changes need the property’s input or sign off and were outstanding at 30 September: completing the Hotel record with the hotel brand, star rating, guest rating and verified profiles; republishing the menu PDFs as pages AI systems can quote, when the room service menu PDF alone has earned a significant volume of search clicks; a room by room meeting capacity grid; a venue marketplace listing; and confirmation of the website’s conversion events.7,9 Separately, the website’s offer pages were removed at the start of August, and all ten offer addresses tested in September ended at a Page Not Found.9 The results in this study reflect the website before the pending changes.

Observable Changes

1 April to 30 September 2026. AI measures are compared on the same platform where possible; website measures are compared with 2025.

  • The hotel is the first answer when the question is specific. In April the hotel was already first for balconies, guaranteed views, small corporate events without a high minimum spend and intimate weddings. By the July and August analyses it held position one, with 100% favourable sentiment, on eight specific questions: it kept the balcony, view and small events answers, and added function rooms with natural light, meeting rooms that open onto outdoor space, a pool long enough to swim laps, nearby bike paths and terraces for private events. It still held position one for small meetings in September, and the market’s leading luxury hotel was absent from three of the five meetings answers tested in July.9
  • Better described, and placed higher. On Google AI Mode, favourable sentiment rose from 77% in April to 100% in September, and average position improved from 4.84 to 3.64. Across all four platforms, favourable sentiment averaged 88% in September, and average position improved from 4.24 in August to 4.04. 9
  • AI assistants became a measurable channel. Google Analytics reported its first AI Assistant sessions for the property in June, then 13, 31, 33 and 102 sessions from June to September, 179 in total, almost all of them from ChatGPT. They engaged at 72.6%, the highest of any channel, against 54.1% site wide, and recorded two key events. The volumes are small and reported as a direction.8,9
  • More of the people shown the website chose it. From July to September, the months with a full prior year, Google search clicks rose 10.6% year on year while impressions fell 21.4%. Click through rate rose from 1.35% to 1.89%, and July was the highest month for clicks in the record.7
Figure 1: AI Assistant sessions by month, and engagement rate by channel, April to September 2026. Source: Google Analytics
Commercial Indicators

Commercial outcomes are taken from the hotel’s own channel reporting, completed by the hotel independently of OmniHyper and of Google Analytics. Each period is compared with the same months of 2025 and 2024.6


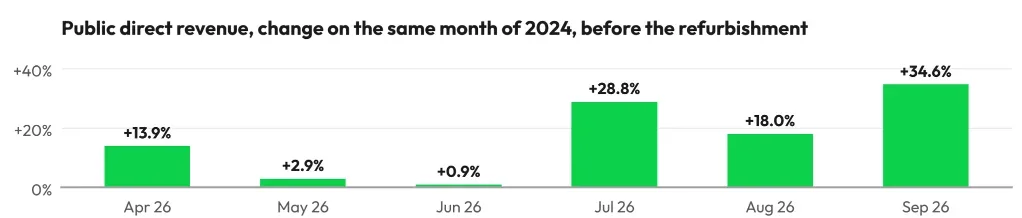
  • Direct revenue grew in every month. Public direct room revenue from April to September was up 30.5% on 2025 and 16.3% on 2024. It was higher than in both prior years in each of the six months.6
  • Against the last normal year, direct grew while OTAs did not. Compared with 2024, direct revenue rose 16.3% while indirect revenue fell 3.5%. Direct room nights held, down just 1.1%, while indirect room nights fell 14.0%. Direct’s share of public room revenue rose from 45.0% to 49.6%.6
  • The gap widened in the second quarter of the programme. From July to September direct revenue was 27.5% above 2024, against 5.6% from April to June, and direct room nights moved from 9.6% below 2024 to 8.0% above it, while indirect room nights stayed 12.3% below. Against 2025, July to September direct revenue rose 48.4% and indirect 41.6%.6
  • September was the strongest direct month in the record. Direct revenue rose 62.6% on September 2025 and 34.6% on 2024, and direct supplied 62.2% of public room revenue, the highest share in the 33 months of the workbook, at 91.4% occupancy.6
  • Rate held. Average daily rate was 4.7% above 2025 and 14.1% above 2024, and the average direct rate was 1.9% above the OTA average.6
  • The brand’s website figures moved the same way. For April to July, the brand reported website revenue up 13.7% on 2025 and 26.0% on 2024. August and September are not yet available. The brand credits the website only on the last click, so earlier influence is unmeasured.10
Figure 2: Public direct room revenue by month, April to September 2024, 2025 and 2026, indexed to the 2024 monthly average (100). Source: hotel internal channel reporting.
Interpretation
In six months, the hotel kept the first answers it already held in AI search and won new ones for the specific questions it is best placed to answer, AI systems came to describe it more favourably, and a new, highly engaged visitor channel opened. Over the same months the hotel’s direct channel grew in every month, and against the last full year before the refurbishment, direct revenue grew while OTA revenue and room nights fell. The improvement cannot be separated between AI Source, the completed refurbishment, the hotel’s revenue management and other marketing. The evidence is consistent with AI Source contributing to it, and this case study does not claim more than that. 

It is also early. AI Source is in month six of a twelve month programme, inside the six to nine months in which AI search usually begins to show commercially, and several of its largest recommended changes are not yet live.9

What is not claimed. Indirect revenue also rose 32.4% on 2025 as the hotel recovered from its refurbishment.6 Winning specific guest needs is not yet broad visibility: share of voice averaged 3.1% across the four platforms in September, and on Google AI Mode the hotel was fifth of the five tracked. The 100% favourable sentiment is Google AI Mode alone; every platform still cites dated rooms.9 Website sessions fell 9.2% and key events, which count booking intent clicks, fell 75.7%. The offer pages removed in early August explain August and September, at 3 and 6 key events, but not April to July, which averaged 42 a month. The events counted in 2025 have not been confirmed, and 2025 data shows anomalies such as 11,730 page views from 123 unassigned sessions, so this comparison may not be like for like.8,9 Email campaigns ran in June and August, alongside the brand’s own marketing.8

The evidence chain

  1. Demand for a Perth hotel grew, and AI Source began on 1 April 2026.2,3
  2. On Google AI Mode, sentiment rose from 77% to 100% and average position from 4.84 to 3.64.9
  3. The hotel kept its April first answers and added five more, holding position one on eight specific questions in July and August.9
  4. AI assistants sent 179 sessions from June, the most engaged channel on the site at 72.6%.8
  5. Direct revenue rose 30.5% on 2025 and 16.3% on 2024, higher in every month.6
  6. Against 2024, direct room nights held while OTA room nights fell 14.0%, and September’s direct share was the highest on record.6

Together, these signals are consistent with AI discovery strengthening the hotel’s direct channel, with influence beyond the last tracked click. A guest who meets the hotel in an AI answer, then books on the brand website, in the brand app or by phone, is credited to the brand rather than to the website or the AI platform.

Most of the evidence comes from systems OmniHyper does not control: Google Search Console, Google Analytics 4, Google Trends, the hotel’s own channel reporting, the brand’s website attribution and published market reports. Taken together, they show credible early evidence for a first mover in Perth’s AI search, not proof of incremental revenue, and a data based starting point for the next six months.

Appendix: Claim-to-Source Map

This case study was designed to minimise reliance on agency reported metrics. Wherever possible, outcomes are drawn from systems owned by Google, the hotel group or the hotel itself, so that every claim can be verified independently.

#ClaimSourceWindowBrand Access
1.Demand: “hotel perth” interest 83 to 96; “accommodation perth” 85 to 87; Perth RevPAR +5.1% YTD June 2026; supply +1.9% a year to 2030Google Trends; Horwath HTL / STR; Destination PerthApr to Sep 2026 vs 2025Public
2.Occupancy 81.5% (2024), 62.9% (2025), 87.7% (2026); full rooms refurbishment in 2025Hotel internal channel reportingApr to Sep 2024 to 2026Hotel / brand internal
3.April baseline: own site 1.9% of AI citations; share of voice 3.5%; position 4.84; sentiment 77%AI Source report (Mae), Google AI ModeApr 2026Reported by OmniHyper
4.Google AI Mode sentiment 77% to 100%, position 4.84 to 3.64; four platform sentiment 88%, position 4.24 to 4.04; position one on eight specific questions, three held from April and five addedAI Source brand analyses (Mae): Google AI Mode, ChatGPT, Perplexity, GeminiApr to Sep 2026Reported by OmniHyper
5.AI Assistant sessions 13, 31, 33, 102 (179); engagement 72.6% vs 54.1% site wide; two key eventsGoogle Analytics 4Jun to Sep 2026Direct (GA4 property)
6.Search clicks +10.6%; impressions −21.4%; click through rate 1.35% to 1.89%; July highest month on recordGoogle Search ConsoleJul to Sep 2026 vs 2025Direct (Google property)
7.Public direct revenue +30.5% vs 2025, +16.3% vs 2024, higher in every monthHotel internal channel reportingApr to Sep 2026Hotel / brand internal
8.vs 2024: indirect revenue −3.5%; direct room nights −1.1%, indirect −14.0%; direct share 45.0% to 49.6%; July to September direct +27.5%Hotel internal channel reportingApr to Sep 2026 vs 2024GA4 direct; reported by OmniHyper
9.September direct revenue +62.6%; direct share 62.2%, highest in 33 months; ADR +4.7%; direct rate 1.9% above OTAHotel internal channel reportingSep 2026; Apr to Sep 2026Sep 2026; Apr to Sep 2026
10.Brand website revenue +13.7% vs 2025, +26.0% vs 2024Brand reporting via hotel workbookApr to Jul 2026Brand internal
11.Website sessions −9.2%; key events −75.7% (2025 definitions unconfirmed); 3 and 6 in August and September after offer pages removed; April to July averaged 42Google Analytics 4; AI Source report (Mae)Apr to Sep 2026 vs 2025GA4 direct; reported by OmniHyper

Every source above is either publicly reproducible or accessible to the brand and the hotel without reliance on OmniHyper, with the exception of the AI platform brand analyses, which are produced inside the AI Source programme. Search and analytics figures can be verified in the property’s own Google Search Console and Google Analytics 4; commercial figures can be verified in the hotel’s own revenue reporting.